Hello,
I upgrade ASTPP from 4.0.1 to 5. All ok during the upgrade but when I access to web management is very slow and some pages no load.
I must do something after upgrade?
Regards,
Hello,
I upgrade ASTPP from 4.0.1 to 5. All ok during the upgrade but when I access to web management is very slow and some pages no load.
I must do something after upgrade?
Regards,
Hello @petidier
If everything was fine, you should not need to do anything.
Once try rebooting the system and check. Please share the screen shot of non working page.
Thanks,
I rebooted the system but the web management still so slow.
Sometimes, I received this message from web borwser:

Previous the upgrade all worked fine.
I confirm this is an issue even on a fresh install of v5.
I’ve not had the chance to debug it myself yet but pages take over a minute in some cases to render the table.
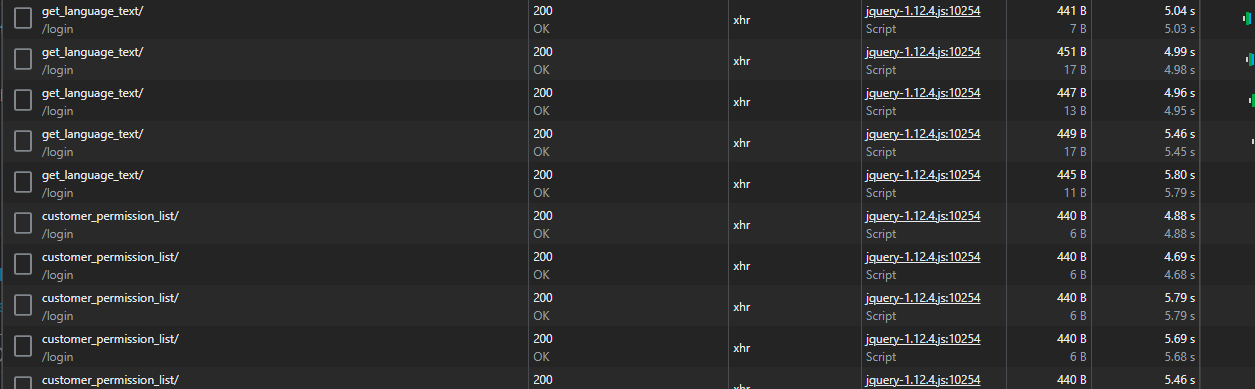
I just actually did a quick scan of network activity, it seems the ajax calls to get_language_text are taking a long time to complete. Then the same with the customer_permission_list
On blocking those two urls from being called using the developer console of chrome, page loads instantly only without the headers on the tables:
OK, Do you think there is a easy solution or preffer rollback to a previous version until good performance?
I am actually just looking into the true root cause of this now as it’s annoying me. I have only just started using V5 on a new cluster I installed to replace an aging installation in the US that I use for high volume call center traffic. This particular installation currently has 10 freeswitch servers on it and I’m seeing daily account growth. Although I have it almost fully integrated with WHMCS so actions such as top-ups, account creation etc is all done from there, I still have some work to do on the auto provisioning of DIDs and IP maps. I’ll post a fix here as soon as I get to it, shouldn’t be long (as in the next couple hours providing no major incidents occur with any of my clients.
We are going to debug for it, thanks @jmurraysolutions for pointing the direction. In the meantime @petidier please log the concern at https://jira.astppbilling.org
Hi again, I had a chance to look at this, I’m suspicious of it being this commit: 5fromlab · iNextrix/ASTPP@5be5e5b · GitHub that is responsible where the use of gettext function is introduced.
Investigating further as I get the time.
False alarm, since gettext was still used on the get_language_text and isn’t used on customer_permission_list
Found the issue, it’s common_model.php function get_dashboard_details.
This is called every time a page is loaded (including AJAX calls).
The problem is the query run on line 172.
$data_array['no_of_calls'] = $this->db_model->getSelect('(ROUND(sum(billseconds) / 60.0, 0) * 60) as total_seconds ,count(*) as total_calls', 'cdrs', $date)->row_array();
This query is what’s holding up the page load times (especially on pages which make multiple ajax calls (basically anything with a grid on it).
For every column header on a grid, and every button on a page, an individual ajax call is made to translate the header of the grid and check the permission of the user to use the buttons defined.
Each time an ajax call is made, the above query is run again, I can see no good reason for this and setting the line to the below does not appear to have affected my installation’s ability to load dashboard data, and page load is now significantly faster.
$data_array['no_of_calls'] = [];
Before Change:
After Change:
You´re a fucking God!! Thank for the solutions.
Hello!
I don’t see any effect from the below changes.
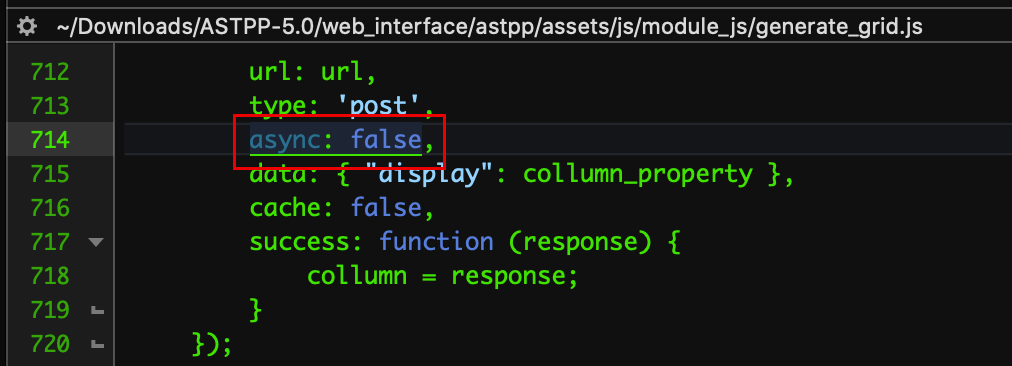
I do however see that there a numerous instances of “async: ‘false’” in many ajax calls. You need to find every instance of this in the code and change to “async: ‘true’”. If you inspect using Firefox dev tools you’ll see this. I also linked jquery to a cdn incase there were changes to jquery itself.
“Synchronous XMLHttpRequest on the main thread is deprecated because of its detrimental effects to the end user’s experience. For more help http://xhr.spec.whatwg.org/”
You’ll also be interested that after optimizing the Nginx config the DB calls are still super slow and the CPU is idling while observing a page load.
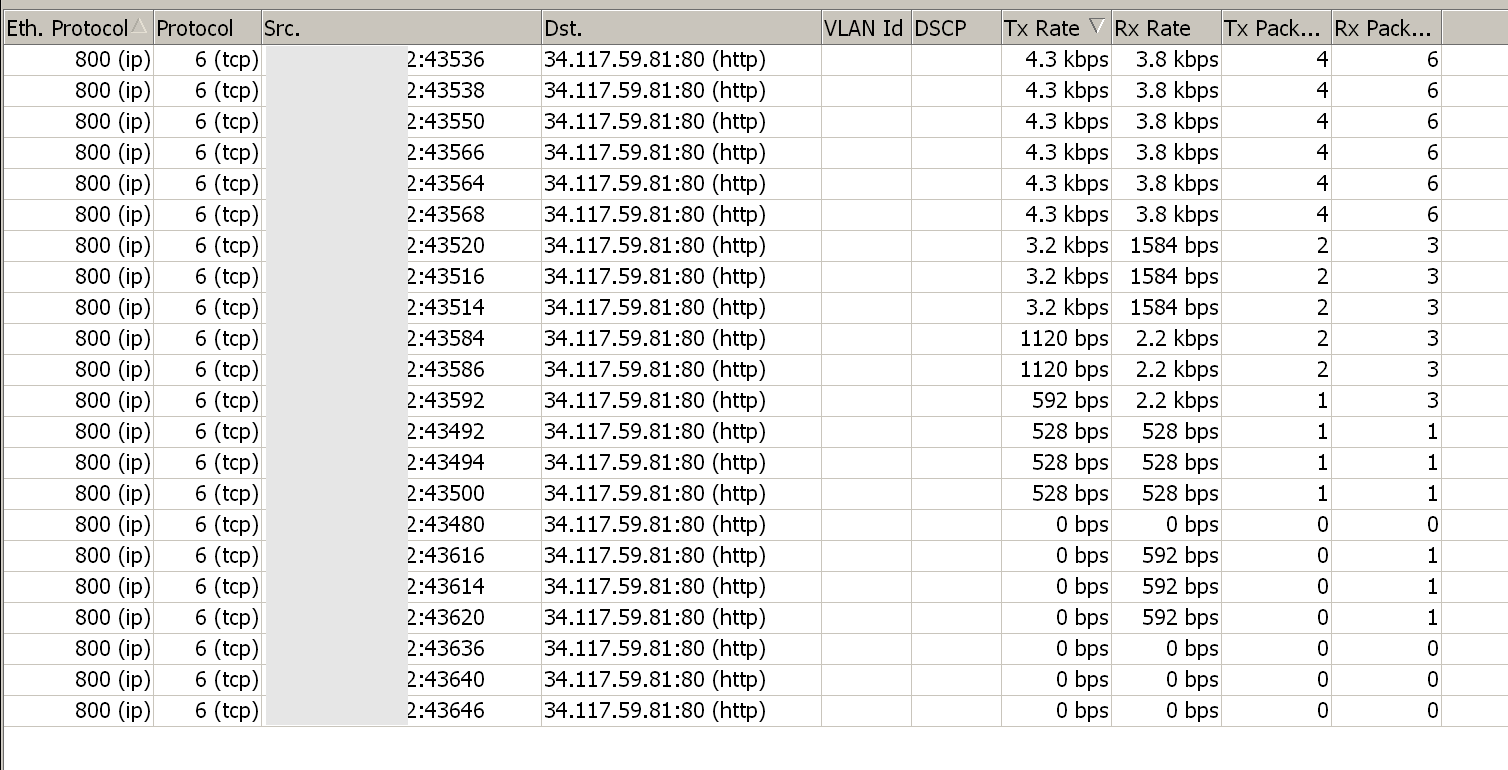
Aaaaaand I have a theory why its slow, and that is because something in ASTPP is calling the following IP, not assets from the UI loading from CDNs in your browser, but from the server itself. If you block this then the ASTPP UI does not load. For me latency to this IP is about 150-300ms and who knows how many times its called with each ASTPP UI page refresh. EDIT: 22 calls per page refresh in ASTPP UI to the IP below.
IP: 34.117.59.81
81.59.117.34.in-addr.arpa name = 81.59.117.34.bc.googleusercontent.com.
For me, this worked on an install that handles anywhere between 1,500,000 and 2,000,000 calls per day. The UI became functional on the grid pages without showing the “page not responding” and the page load time went to just a couple of seconds from around a minute before.
In my situation, I handle high volume short duration dialer traffic and the CDR table gets extremely large. The larger it is, the longer that query takes to run. A low volume system may not see much of a difference by disabling that apparently useless query (I’ve witnessed no missing dashboard data etc) since if the CDR table is relatively empty, the query should complete in an acceptable time.
I agree there’s probably more issues in this case to resolve, however as I already got mine working to an acceptable level, I don’t have any plans to revisit this right now, I’d rather spend the time adding something of value like NPANXX rates (inter, intra, indeterminate) and LRN routing.
Did your CPU max during requests before the change? Also have you optimized Nginx config? It was slow for me before ( around 15 seconds), so I’d imagine that with more load yours would have taken much longer, but as soon as I changed the async property in all custom js occurrences it loads in about 2-3 seconds.
In my situation, I handle high volume short duration dialer traffic and the CDR table gets extremely large. The larger it is, the longer that query takes to run. A low volume system may not see much of a difference by disabling that apparently useless query (I’ve witnessed no missing dashboard data etc) since if the CDR table is relatively empty, the query should complete in an acceptable time.
I’m pretty sure that the UI doesn’t process the CDRs each time you load the page, and it certainly doesn’t require js. If your CPU spikes on the Mysql process then thats a large query, if it doesn’t then in my mind the slow down is due to the 22 requests it makes from the server itself per page load and some inefficient ajax calls (async true being one of them) on the client UI side.
I agree there’s probably more issues in this case to resolve, however as I already got mine working to an acceptable level, I don’t have any plans to revisit this right now, I’d rather spend the time adding something of value like NPANXX rates (inter, intra, indeterminate) and LRN routing.
I installed last week and when I have a gap I kick the tyres to see how its been put together.
If your server does not have internet access the UI WILL NOT LOAD.
I hope this helps others.
Hello, maybe you can tell me how to made that scan on the network activity? I’m having the same issue but this solution isn’t working for me.
Did you change the property in the js code from “async: false” to “async: true”? I think the server originating requests and async property would need to be done by the ASTPP team, and merged into the release tree for the code. So someone needs to report it on the bug tracker.